Were the Conners 4 Norms Affected by the COVID-19 Pandemic?
The COVID-19 pandemic and its associated public health response have led to the enforcement of restrictions such as physical distancing, in-person school closures, shifts to online learning, and reductions in community and school-based services and extracurricular activities. While these measures helped control the spread of COVID-19, they were unprecedented and had unintended consequences, such as adversely affecting child and adolescent mental health.
As part of our commitment to our users, Multi-Health Systems (MHS) ensures that we provide reliable and scientifically validated products and solutions that empower our customers to help others obtain improved outcomes. One aspect of our process is to ensure our products’ norm scores are up to date. Norm scores are a kind of test score baseline that allows us to answer questions, such as “is this youth’s score typical of other youth this age?”. Setting this baseline is essential as future scores depend on it as a point of reference—this practice helps ensure the validity of test interpretation.
Due to the pandemic’s links to mental health declines, it is important to determine whether norm samples established pre-pandemic are outdated or still represent an appropriate baseline. For example, the Conners 4th Edition (Conners 4®) (Conners 4; Conners, 2022), a measure of ADHD symptoms and related concerns for youth aged 6 to 18 years old, was normed using a large, representative sample collected pre-pandemic in 2019.
Comparing Conners 4 scores pre- and post-pandemic
We conducted a study to discover how parent and teacher ratings of youth from the general population may have changed from 2019 to 2022. In June 2022, 280 parents and 275 teachers completed the Conners 4 Parent or Teacher forms, respectively. We compared the scores from these samples to scores from demographically matchedi samples from the norms collected pre-pandemic in 2019. Statistical analyses were conducted to determine whether: (1) scale structures remained consistent, (2) scale reliabilities stayed the same, and (3) scale scores changed over this period.
- We examined the overall factor structure of the Conners 4 to see if a change had occurred across the two samples. If we found a change, it would indicate that the items and scales of the Conners 4 were functioning differently than they used to—perhaps people were interpreting the items differently, or something more fundamental changed about the way ADHD symptoms and features were measured. For both parent and teacher raters, we found no statistically significant difference in the Conners 4 factor structure, which suggests that the scale structure has remained the same and there remains strong evidence of structural validity.
- We also estimated both samples’ scale reliabilities via internal consistency estimatesii. Internal consistency estimates indicate how well items of a scale hang together (i.e., measure the same thing). We found no meaningful differences from 2019 to 2022 in the reliability of the scales for both the Parent and Teacher forms (internal consistency coefficients for the 2019 and 2022 samples were, on average, within .01 of each other).
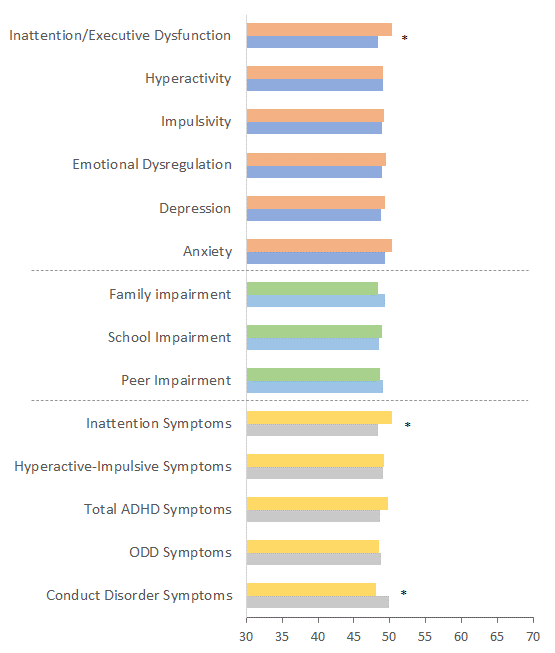
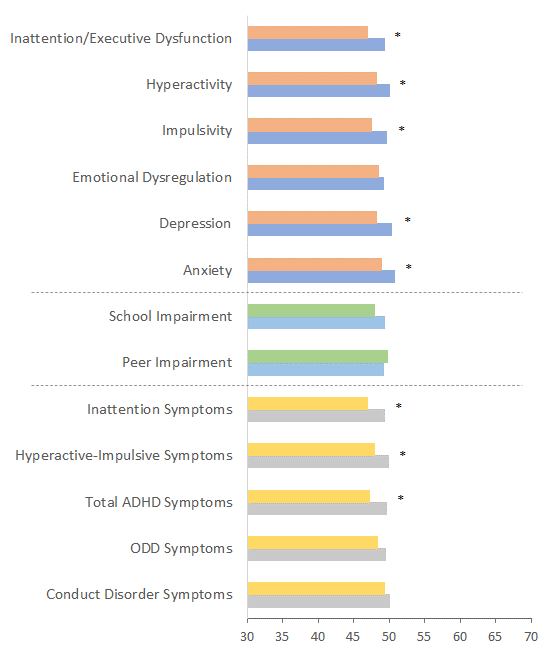
- We examined the Conners 4 scale scores to see if the scores differed, which may indicate a shift in symptoms and features related to ADHD between the two samples. Figure 1 shows the average scores for the scales and their respective differences in both samples. Some statistically significant differences were found; however, the effect sizes were quite small (effect sizes measure how large or meaningful the differences are; values below 0.49 are generally considered small); Cohen’s d effect sizes ranged from 0.00 to 0.28. This finding means that the scores are comparable across the two samples for both rater forms.


Figure 1. Comparison of Scale Scores Between 2019 and 2022 Sample for the Parent and Teacher Forms: Note. *p <.05
In summary, we found great stability in the structure, reliability, and scale scores of the Conners 4 between the 2019 and 2022 general population samples. These results mean that you can use the norms with confidence, and you can use the data that you get from the Conners 4 to gain valuable insights about your clients.
Learn more about the Conners 4.
i Rated youth were matched on key demographic variables including age, gender, and race/ethnicity.
ii Ordinal alpha and omega were used as estimates of internal consistency.


